
SOUTH-EAST REGION
POPULATION
Age and gender structure of the population
The South-Eastern region with density of population of 63, 2 км2 is fifth from the planned regions, after the Skopje, Polog, North-Eastern and South-Western region. The average age of the population in the South-Eastern region is identical with the national average, which is 38 years.
Figure: Age structure of Republic of Macedonia by regions
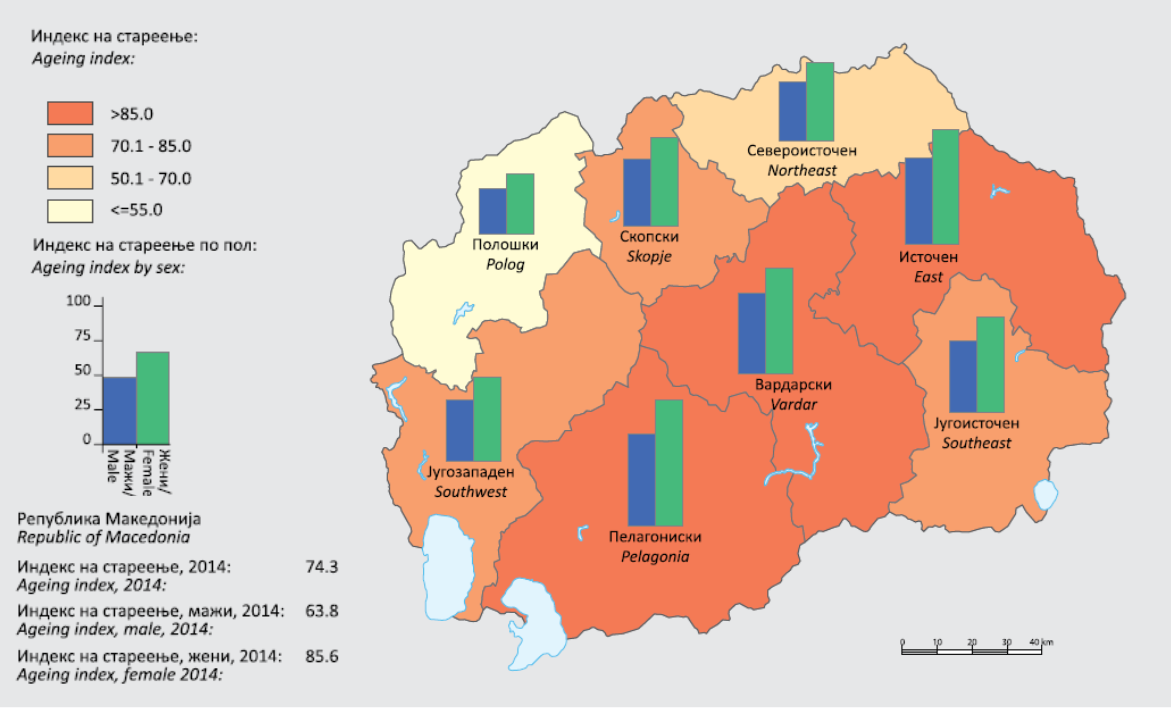
Source: State Statistical Office, The Regions in the Republic of Macedonia, 2015
Figure: Population pyramid of the South-East region
{flashchart data="0-4,5-9,10-14,15-19,20-24,25-29,30-34,35-39,40-44,45-49,50-54,55-59,60-64,65-69,70-74,75-79,80+ /4969,4665,4903,5343,6186,6985,7165,6697,6389,6614,6569,6341,5134,3625,2788,1893,1474|4681,4626,4770,5202,5998,6504,6306,5986,5695,5982,6080,6010,5284,4139,3436,2587,2459" type="bar_simple" tooltip="#x_label#: #val#>Total #total#" title="Population pyramid" height="300" dimension="" label_fontsize="11" x_label_rotate="40" x_step="1" legend="Men,Women" right_legend="0" show_barvalues="3" bg_image="plugins/content/flashchart/images/pv_system.jpg"}sample00{/flashchart}
Source: State Statistical Office, The Regions in the Republic of Macedonia, 2015
Educational structure of the population
Table: General information according to the level of education
|
Index |
2008/9 |
2009/10 |
2010/11 |
2011/12 |
2012/13 |
2013/14 |
2014/15 |
|---|---|---|---|---|---|---|---|
|
Primary education |
|||||||
|
Number of primary schools |
119 |
119 |
119 |
119 |
118 |
118 |
119 |
|
Teachers in primary school (%) |
8,4 |
7,2 |
9,2 |
9,2 |
9,2 |
9 |
9 |
|
Enrolled students in primary education (%) |
7,9 |
7,9 |
7,9 |
7,8 |
7,8 |
7,4 |
7,4 |
|
Number of students per school |
139 |
136 |
132 |
129 |
126 |
120 |
120 |
|
Number of students in primary education per teacher |
12 |
11 |
10 |
10 |
10 |
9 |
9 |
|
Secondary education |
|||||||
|
Number of secondary schools |
7 |
7 |
8 |
8 |
8 |
8 |
8 |
|
Professors in secondary education (%) |
6,3 |
6,3 |
6,4 |
6,3 |
6,4 |
6,4 |
6,4 |
|
Enrolled students in secondary education (%) |
7,4 |
7,5 |
7,4 |
7,4 |
7,4 |
7,3 |
7,3 |
|
Graduated students in secondary education (%) |
6,9 |
6,8 |
7,5 |
7,2 |
6,9 |
7,5 |
7,6 |
|
Number of students in secondary education per professor |
16 |
16 |
15 |
14 |
14 |
13 |
14 |
|
High education |
|||||||
|
Index |
2008/9 |
2009/10 |
2010/11 |
2011/12 |
2012/13 |
2013/14 |
2014/15 |
|
Number of enrolled students |
4.344 |
4.38 |
4.814 |
/ |
/ |
/ |
/ |
|
Number of graduated students |
596 |
638 |
653 |
795 |
661 |
661 |
751 |
|
Number of graduated students per 1.000 population |
3,5 |
3,7 |
3,8 |
4,6 |
3,8 |
3,8 |
4,3 |
Source: State statistical office of the Republic of Macedonia (Census 2002 and “The Regions in the Republic of Macedonia2012 and 2014” “Regions in Republic of Macedonia 2015”.
Total number of enrolled students in primary and high school in the Republic of Macedonia and in the South-East planned region for the school year 2008/09-2014/15
Table: General information according to the level of education
|
Indicators |
2008/9 |
2009/10 |
2010/11 |
2011/12 |
2012/13 |
2013/14 |
2014/15 |
|---|---|---|---|---|---|---|---|
|
Number of enrolled students in primary education in Macedonia |
216.180 |
210.381 |
204.439 |
198.856 |
195.311 |
191.051 |
192.165 |
|
Number of enrolled students in primary education in the South-East region |
16.798 |
16.539 |
16.148 |
15.693 |
15.318 |
14.899 |
14.276 |
|
% of enrolled students on national level |
7,77 |
7,86 |
7,90 |
7,89 |
7,84 |
7,80% |
7,43% |
|
Number of enrolled students in high school in Macedonia |
93.843 |
95.343 |
94.155 |
93.064 |
89.884 |
86.418 |
83.522 |
|
Number of enrolled students in high school in the South-East region |
7.155 |
7.084 |
7.026 |
6.889 |
6.613 |
6.415 |
6.098 |
|
% of enrolled students on national level |
7.155 |
7,43 |
7,46 |
7,40 |
7,36 |
7,42% |
7,30% |
Source: State Statistical Office of Republic of Macedonia,
„Regions in the Republic of Macedonia 2012, 2014 and 2015.
In the school year 2014/2015 the number of elementary school in the South-East region is 119, while the number of high schools is 8. According to the number of graduated students per 1.000 population which is 4, 3, the South-East region is fifth from eight planned regions.
ECONOMIC ACTIVITY OF THE POPULATION
Table: Activity rate of the population at the age of 15, and above
|
RM |
SouthEast region |
RM |
SouthEast region |
RM |
SouthEast region |
RM |
SouthEast region | |
|---|---|---|---|---|---|---|---|---|
|
|
2011 |
2012 |
2013 |
2014 |
||||
|
Population capable for working |
1.656.215 |
140.279 |
1.669.965 |
140.857 |
1.672.460 |
140.938 |
1.673.494 |
140.921 |
|
Activity rate |
56,8 |
71 |
56,5 |
70,7 |
57,2 |
69,9 |
57,3 |
66,9 |
|
Employment rate |
38,9 |
64,4 |
39 |
60,9 |
40,6 |
56,8 |
41,2 |
52,9 |
|
Unemployment rate |
31,4 |
9,3 |
31 |
13,8 |
29 |
18,8 |
28 |
20,8 |
Source: State Statistical Office, The Regions in the Republic of Macedonia, 2015
Figure: Activity rate of population in the Republic of Macedonia by regions
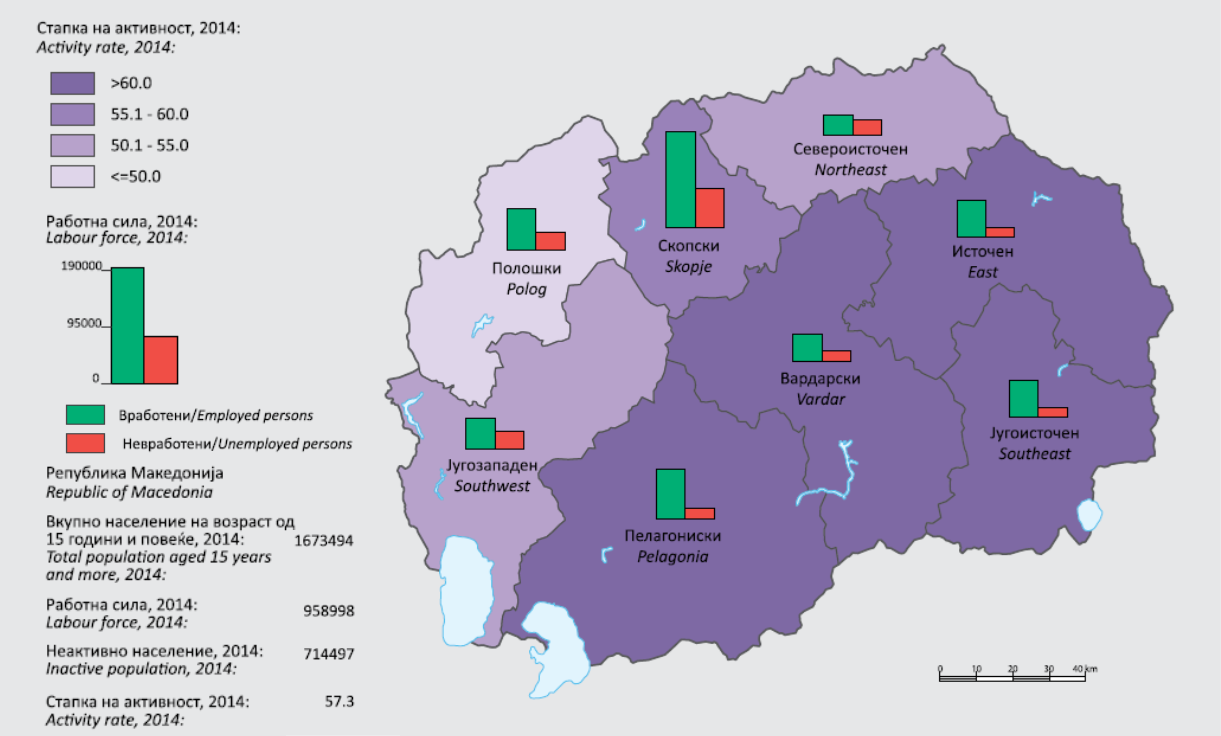
Source: State Statistical Office, The Regions in the Republic of Macedonia, 2015
In 2014, the South-East region has the second highest employment rate of 52, 9% in comparison to the other regions. With unemployment rate of 20, 8%, the South-East region is far beyond the average of the Republic of Macedonia, which is 28%.
Table: Unemployment rate (%)
|
RM |
SouthEast region |
РМ |
SouthEast region |
РМ |
SouthEast region |
РМ |
SouthEast region | |
|---|---|---|---|---|---|---|---|---|
|
2010 |
2011 |
2012 |
2014 |
|||||
|
Total |
32 |
11,5 |
31,4 |
9,3 |
31 |
13,8 |
28 |
20,8 |
|
Man |
31,9 |
12,4 |
31,8 |
8,8 |
31,5 |
12,6 |
27,6 |
21 |
|
Women |
32,2 |
10,4 |
30,8 |
9,9 |
30,3 |
15,2 |
28,6 |
20,6 |
|
Urban part |
31,6 |
22,4 |
32,1 |
19,1 |
30,8 |
23,7 |
29,2 |
31,2 |
|
Man |
31,7 |
24 |
32,6 |
17,9 |
31,5 |
20,4 |
29 |
32,6 |
|
Woman |
31,5 |
20,3 |
31,4 |
20,6 |
29,7 |
27,6 |
29,4 |
29,5 |
|
Rural part |
32,6 |
3,7 |
30,3 |
3,4 |
31,4 |
7,5 |
26,5 |
12,4 |
|
Man |
32,1 |
4,1 |
30,7 |
3,3 |
31,4 |
7,8 |
26,1 |
12,2 |
|
Women |
33,6 |
3,3 |
29,6 |
3,6 |
31,4 |
7 |
27,3 |
12,7 |
Source: State Statistical Office, The Regions in the Republic of Macedonia, 2015
In 2014, the male unemployment rate among men was 21 %, whereas among women it was 20,6 %. The South-Eastern region has the lowest unemployment rate in rural areas, out of all the regions which is 12,2 5%. The unemployment rate among women in the rural areas is 12, 7%.
Figure: Active job seekers by age and gender
{flashchart data="15-19,20-24,25-29,30-34,35-39,40-44,45-49,50-54,55-59,60+/126,368,439,325,368,361,388,457,535,569|100,404,379,332,300,252,259,299,311,256" type="bar_horizontal" tooltip="#x_label#: #val#
>Total #total#" title="Active job seekers" height="400" dimension="" label_fontsize="11" x_label_rotate="40" x_step="100" legend="Men,Women" right_legend="0" bg_image="plugins/content/flashchart/images/pv_system.jpg"}sample02{/flashchart}
Source: Employment Service Agency, Republic of Macedonia, 2015.
Figure: Passive jobseekers by age and gender
{flashchart data="15-19,20-24,25-29,30-34,35-39,40-44,45-49,50-54,55-59,60+/73,485,634,676,732,712,772,742,730,533|66,412,600,595,625,595,610,576,572,221" type="bar_horizontal" tooltip="#x_label#: #val#
>Total #total#" title=" Passive jobseekers" height="400" dimension="" label_fontsize="11" x_label_rotate="40" x_step="100" legend="Men,Women" right_legend="0" bg_image="plugins/content/flashchart/images/pv_system.jpg"}sample03{/flashchart}
Source: Employment Service Agency, Republic of Macedonia, 2015.
The total number of registered unemployed people is 17.789 (active and passive employment seekers). It can be noticed that the number of unemployed persons is higher among men (10.025) than among women (7.764).
Table: Number of unemployed people (active employment seekers) in the South-Eastern planned region according to the level of education
|
Total number of registered persons |
Total |
Women |
Man |
|---|---|---|---|
|
With no education and with primary education |
1.002 |
499 |
503 |
|
Incomplete secondary education |
2.333 |
1.172 |
1.161 |
|
Completed secondary education |
2.594 |
1.031 |
1.563 |
|
High education (two years after secondary education) |
232 |
105 |
127 |
|
High Education |
1.083 |
656 |
427 |
|
MA / MSc. |
50 |
27 |
23 |
|
PhD |
2 |
1 |
1 |
|
TOTAL |
5.929 |
2.702 |
3.227 |
Source: Employment Service Agency, Republic of Macedonia, 2015.
In the South-Eastern region, the biggest number of unemployed persons is among those who have completed a secondary education (1,985). Next follow those persons without any education, and those with primary education (1,643). There are also a high number of unemployed people with higher education (1,083). Among men, the highest number of unemployed men is without education, or with primary education (1,020), whereas the highest number of unemployed women is with completed secondary education (1,037). The number of unemployed women with higher education qualifications (656) is higher than the number of unemployed men with the same (427).
Table: Average net salary per employee, 2014 (in Denars)
|
Sectors |
Average net salary per employee |
|||
|---|---|---|---|---|
|
2012 |
2014 |
|||
|
RM |
SE Region |
RM |
SE Region |
|
|
Agriculture, forestry, fishery | 15.641 | 13.188 | 15.843 | 13.871 |
|
Mine work, and stone digging | 22.180 | 24.240 | : | |
|
Processing industry | 15.300 | 12.440 | 16.177 | 13.021 |
|
Electricity, gas, steam supply, and air-conditioning | 35.818 | 36.740 | : | |
|
Water supply, waste management and environmental repair | 18.677 | 15.034 | 18.959 | 15.363 |
|
Engineering | 16.375 | 11.476 | 18.589 | 13.494 |
|
Wholesale, and retail trade; repair of cars and motor cycles | 18.982 | 17.318 | 19.794 | 15.576 |
|
Transport and storage | 21.191 | 14.069 | 22.923 | 14.613 |
|
Accomodation and catering services | 15.063 | 15.873 | 15.015 | 15.093 |
|
Information and Communications | 35.481 | 23.481 | 34.692 | 29.670 |
|
Financial, and insurance activities | 37.397 | 30.436 | 38.791 | 31.406 |
|
Activities with immovable property | 24.998 | 26.489 | : | |
|
Professional, scientific, and technical activties | 28.096 | : | 29.332 | : |
|
Administrative and service activities | 14.066 | 12.373 | 14.503 | 12.626 |
|
Public administration and defense; obligatory social insurance | 24.966 | 23.251 | 25.325 | 23.259 |
|
Education | 21.235 | 19.652 | 21.501 | 19.746 |
|
Activities for health and social protection | 22.399 | 19.525 | 23.736 | 20.210 |
|
Art, entertainment, recreation | 17.731 | 21.045 | 18.230 | 19.664 |
|
Other service services | 23.155 | 18.620 | 23.876 | 17.176 |
Source: State Statistical Office, The Regions in the Republic of Macedonia, 2015
The average net monthly salary per employee in the South-Eastern region in 2014 was 16,600 denars, or 79.4% of the national average. The highest average net salary per employee in the region is in sector information and communications in amount of 31.406 denars.